

Covid 19 Demographics
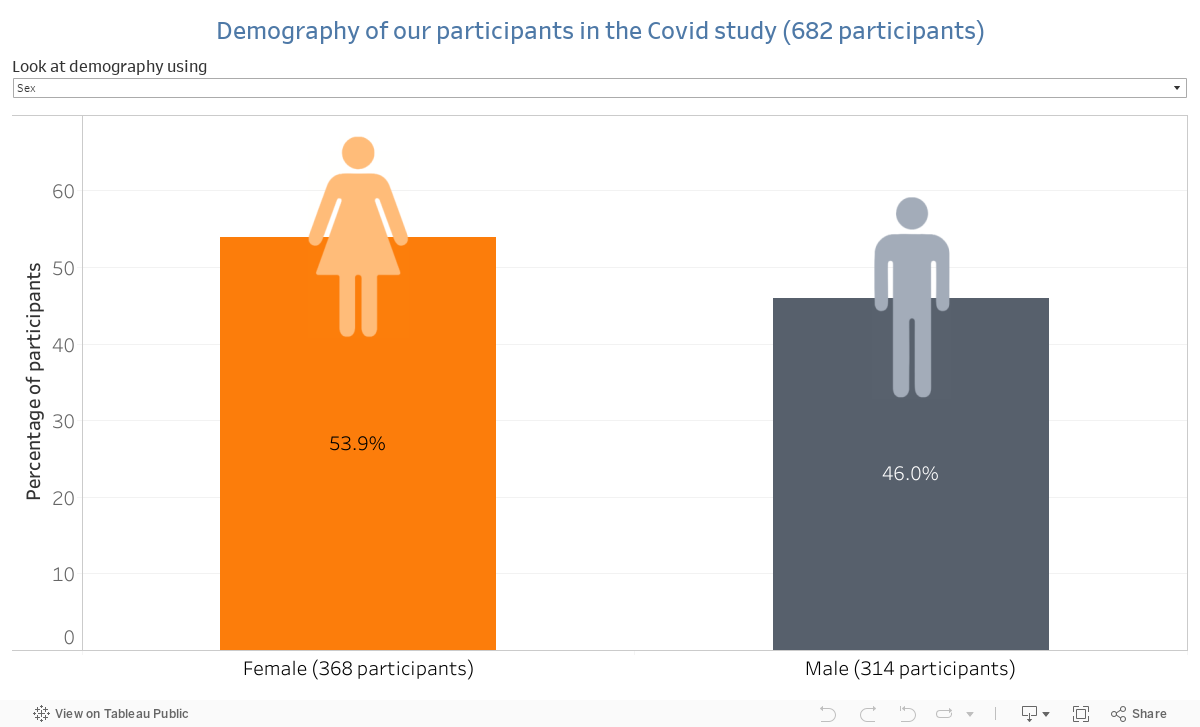
Sex
This graph shows the number of male and female participants were in the study. 368 women and 314 men took part in the study.
Age Category
This graph shows the number of people in the study in each age group. 129 people were aged 40-49 years. 380 people were aged 50-64 years. 173 people were aged 65 years or older.
Cause of ID
This graph shows the cause of intellectual disability for the people who took part in the study. 125 people in the study had Down syndrome. 557 people in the study had another or an unknown cause of disability.
ID Level
This graph shows the level of intellectual disability of people who took part in the study. 187 people had a mild intellectual disability. 283 people had a moderate intellectual disability. 174 people had a severe or profound intellectual disability.
Living Circumstances
This graph shows the type of homes the people in the study lived in. 337 people lived in a group home in the community. 119 people lived independently or with their family. 219 people lived in a residential care home.